National Summary

Upper level

Thriving Places Wales is based on the same methodology as the Thriving Places Index (for England), and shares the same structure of Dimensions, Domains and Sub-domains. However, the indicator data that contributes to the scores at these levels differs due to the devolved nature of some of the areas covered by indicators. Where indicators differ, Thriving Places Wales uses a ‘best-fit’ principle to replicate the indicators in the Thriving Places Index. More details on how Thriving Places Wales works can be found in the Methodology tab.

Scores in Thriving Places Wales are relative to the Welsh average for that particular year. This means the Index should not be used to compare the scores of one area over time. Also, changes in the indicator list will affect the comparability of scores over time.

Because of the difference in indicators used, it is also not possible to compare areas in Wales with areas in England.

Depending on when updates for indicators were last published and the time period these cover, some indicator data used in this update may show the impact of COVID-19 (from March 2020 onwards).

Because of the methodology, the dimension scores show the smallest variation from the mean of any part of the Index. Scores range from 3.75 (for Local conditions in Blaenau Gwent) to 7.48 (for Equality on the Isle of Anglesey)

Neath Port Talbot, Rhondda Cynon Taf and Caerphilly have dimensions scores all below the Welsh average.

Nine local authority areas have two dimension scores above the Welsh average, and three local authority areas, Pembrokeshire, Vale of Glamorgan and Cardiff, have all three dimension scores above the Welsh average.

The three highest scores at the dimension level are (Isle of Anglesey, Gwynedd and Ceredigion) in the Equality dimension.
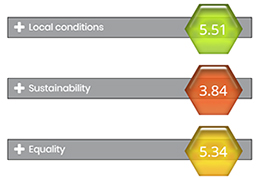
Local conditions

This local condition dimension contains five domains:

  • Place and environment
  • Mental and physical health
  • Education and learning
  • Work and local economy
  • People and community.

At a domain level, scores range from 2.33 for Mental and physical health in Blaenau Gwent to 6.79 in Monmouthshire.

Every local authority area scores above the Welsh average for at least one domain.

Six local authority areas have at least four domain scores above the Welsh average, with Gwynedd and the Vale of Glamorgan, the only authorities to do so in all five domains.

Within the local conditions dimension, there are 18 sub-domains. At this level of the tool, with fewer indicators contributing to scores, there is more variation in the scores across the local authority areas.

Scores range from 0.51 (for Social isolation in Torfaen) to 8.69 (for Mortality and life expectancy in Monmouthshire).

Scores show that no one area is very good or very bad across all sub-domains. Whilst the lowest scores are most frequently seen in the South Wales Valleys, these areas also have some of the highest sub-domain scores within local conditions. For instance, whilst Blaenau Gwent has nine scores below 3.5 marks, it also has the highest scores of all local authority areas for the local environment and Housing sub-domains.

Likewise, the Merthyr Tydfil local authority area has eight sub-domain scores below 3.5 marks, but has the highest score of all local authorities for Good Jobs.

At the opposite end of the scale, Powys has five scores above 6.5 marks, but the lowest score in Wales for Transport.

Sustainability

The Sustainability dimension contains three sub-domains:

  • Green infrastructure
  • Waste
  • Energy use.

Scores in these sub-domains range from 1.25 for Energy use in Neath Port Talbot to 6.82 in Cardiff. However, Neath Port Talbot also has the fifth highest score of all local authority areas for Green infrastructure.

Three local authority areas have three sub-domain scores below the Welsh average: Isle of Anglesey, Gwynedd and Flintshire.

Two local authority areas (Bridgend and Newport) have scores above the Welsh average for all three sub-domains.

Equality

The Equality dimension has three sub-domains:

  • Health inequality
  • Income inequality
  • Employment inequality.

Scores range from 2.34 (for Employment inequality in Neath Port Talbot) to 9.20 (for Health inequality in Gwynedd). However, Neath Port Talbot also scores above the Welsh average for Health inequality.

Denbighshire and Bridgend score below the Welsh average for all three sub-domains.

Three local authority areas score above the Welsh average in all three sub-domains: the Isle of Anglesey, Gwynedd and Flintshire.

Local conditions

Domain

Sub-domain

Indicator

Description

Source

Place and environment

Local environment

Green land cover

Sum of % cover of green urban and natural green space (Corine land cover classification)

The University of Sheffield

Proximity to green space

Access to private garden space - % of properties with access to private garden or outdoor space

Office for National Statistics

Access to public parks and playing fields - average distance (m) to nearest park, public garden or playing field

Office for National Statistics

NO2 concentration*

Nitrogen dioxide (NO₂) concentration at residential dwelling locations (micrograms/m3)

Welsh Government

Transport

Active travel

Percentage of respondents who go to work through active travel

2011 Census

Office for National Statistics

Car traffic

Volume of road traffic per head of population

Department for Transport

Traffic accidents rate

Rate of road traffic accidents (per 1,000 population)

Welsh Government

Access to services

Average time taken to access 8 services by public transport

Welsh Index of Multiple Deprivation, Welsh Government

Safety

Primary youth offenders

First time entrants to the youth justice system (per 100,000)

Ministry of Justice

Crime Severity Index

Crime Severity Index

Office for National Statistics

Rate of domestic-abuse related offences and incidents

Rate (per 1,000) of domestic abuse-related incidents and crimes recorded by the police, by police force area

Office for National Statistics

Perception of crime*

Percentage of people who feel safe at home, walking in the local area, and when travelling (aged 25+)

National Survey for Wales

Housing

Housing affordability

Ratio of median house price to median gross workplace-based earnings

Office for National Statistics

Homelessness numbers

Number of households accepted as being homeless and in priority need (Section 75) (per 10,000 households)

Welsh Government

Housing quality

Percentage of households likely to be in poor quality (being in disrepair or containing serious hazards)

Welsh Index of Multiple Deprivation, Welsh Government


Mental and physical health

Healthy and risky behaviours

Child obesity rate

Percentage of children aged 5 who are of healthy weight; Child Measurement Programme

Public Health Wales Observatory

Children participating in sport 3 or more times a week

Percentage of children participating in sport 3 or more times a week

Sport Wales

Teenage pregnancies

Conceptions at ages under 16 per 1,000 women

Office for National Statistics

Healthy lifestyles - adults

Percentage of adults that only achieve 1 or fewer of 5 defined healthy lifestyle behaviours (age standardised)

National Survey for Wales

Overall health status

Subjective disability

Percentage of adults reporting being free from limiting illness

Public Health Wales Observatory

Subjective health

Percentage of adults aged 16+ years reporting ‘good’ or ‘very good’ health

National Survey for Wales

Mortality and life expectancy

Preventable mortality rate

Rate of mortality from causes that are preventable

Office for National Statistics

Life expectancy

Average life expectancy at birth (years)

Public Health Wales Observatory

Mental health

Mental well-being in adults

Warwick-Edinburgh well-being scale (age-standardised)

Public Health Wales Observatory


Education and learning

Adult education and learning


Adults with low level skills

Percentage of working age people with no qualifications - aged 16-64

Welsh Government

Adult education participation

Unique learners (per 1,000 population) enrolled at Further Education institutions in work-based learning provisions (aged 25+)

Welsh Government

Apprenticeships

Rate of apprenticeship starts – aged 16-64

Welsh Government

Children’s education and learning

Educational attainment of children

KS4 average points score in core subjects (Maths, English/Welsh, science)

Welsh Government

School readiness

Percentage of all 7 year olds achieving the expected level at the end of the Foundation Phase

Welsh Government


Work and local economy

Unemployment

Unemployment rate

Percentage of economically active people who are unemployed

Office for National Statistics

Good jobs

Job satisfaction*

Percentage of adults who are ‘moderately’ or ‘very’ satisfied with their jobs

National Survey for Wales

Working 49+ hours

Percentage of working population working 49 hours or more

2011 Census

Office for National Statistics

Deprivation

Material deprivation*

Percentage of people living in households in material deprivation

National Survey for Wales

Local business

Local business

Ratio of enterprises to local units

Office for National Statistics


People and community

Participation

Election turnout

Total vote turnout (inc. rejected postal votes and votes rejected at count) for EU Referendum in Wales

The Electoral Commission

% of people who volunteer*

Percentage of people who volunteer

National Survey for Wales

Able to influence decisions affecting their local area*

Percentage who feel able to influence decisions affecting their local area

National Survey for Wales

Culture

Heritage index

RSA Heritage Index - Activities sub Index

RSA

Social isolation

Social isolation in adults*

Percentage of 16+ people who are lonely

National Survey for Wales

Community cohesion

Sense of belonging*

Percentage of people who agree that there is good community cohesion in their local area

National Survey for Wales

Social fragmentation index

Social fragmentation index

Office for National Statistics

Sustainability

Domain

Sub-domain

Indicator

Description

Source

Sustainability

Green Infrastructure

Household energy efficiency

Percentage of registered properties with domestic EPC rating of C or above

Gov.UK

Ecological footprint*

Ecological footprint per capita

Welsh Government

Renewable energy produced

Energy produced in large renewable energy projects per capita

Department for Business, Energy & Industrial Strategy

Waste

Waste generation

Total municipal waste collected/recycled per capita

Welsh Government

Household recycling

Percentage of waste reused / recycled / composted

Welsh Government

Energy use

Domestic energy consumption

Household energy consumption per 1,000 people

Gov.UK

CO2 emissions

CO2 emission estimates per capita; industry, domestic and transport sectors

Department for Business, Energy & Industrial Strategy

Equality

 Domain

Sub-domain

Indicator

Description

Source

Equality

Health inequality

Difference in HLE and LE

Slope index of inequality (SII) in life expectancy at birth - average for males and females (SII years)

Welsh Government

Income inequality

Pay gap

75/20 percentile ratio of weekly earnings

Office for National Statistics

Gender pay gap

Gender pay gap; absolute difference in median gross hourly earning between men and women

Office for National Statistics

Employment inequality

Employment rate

Gap in employment rate between those with a long-term health condition and the overall employment rate

Public Health Wales